COMPLETIONS FOR HIGH PERFORMING TEAMS

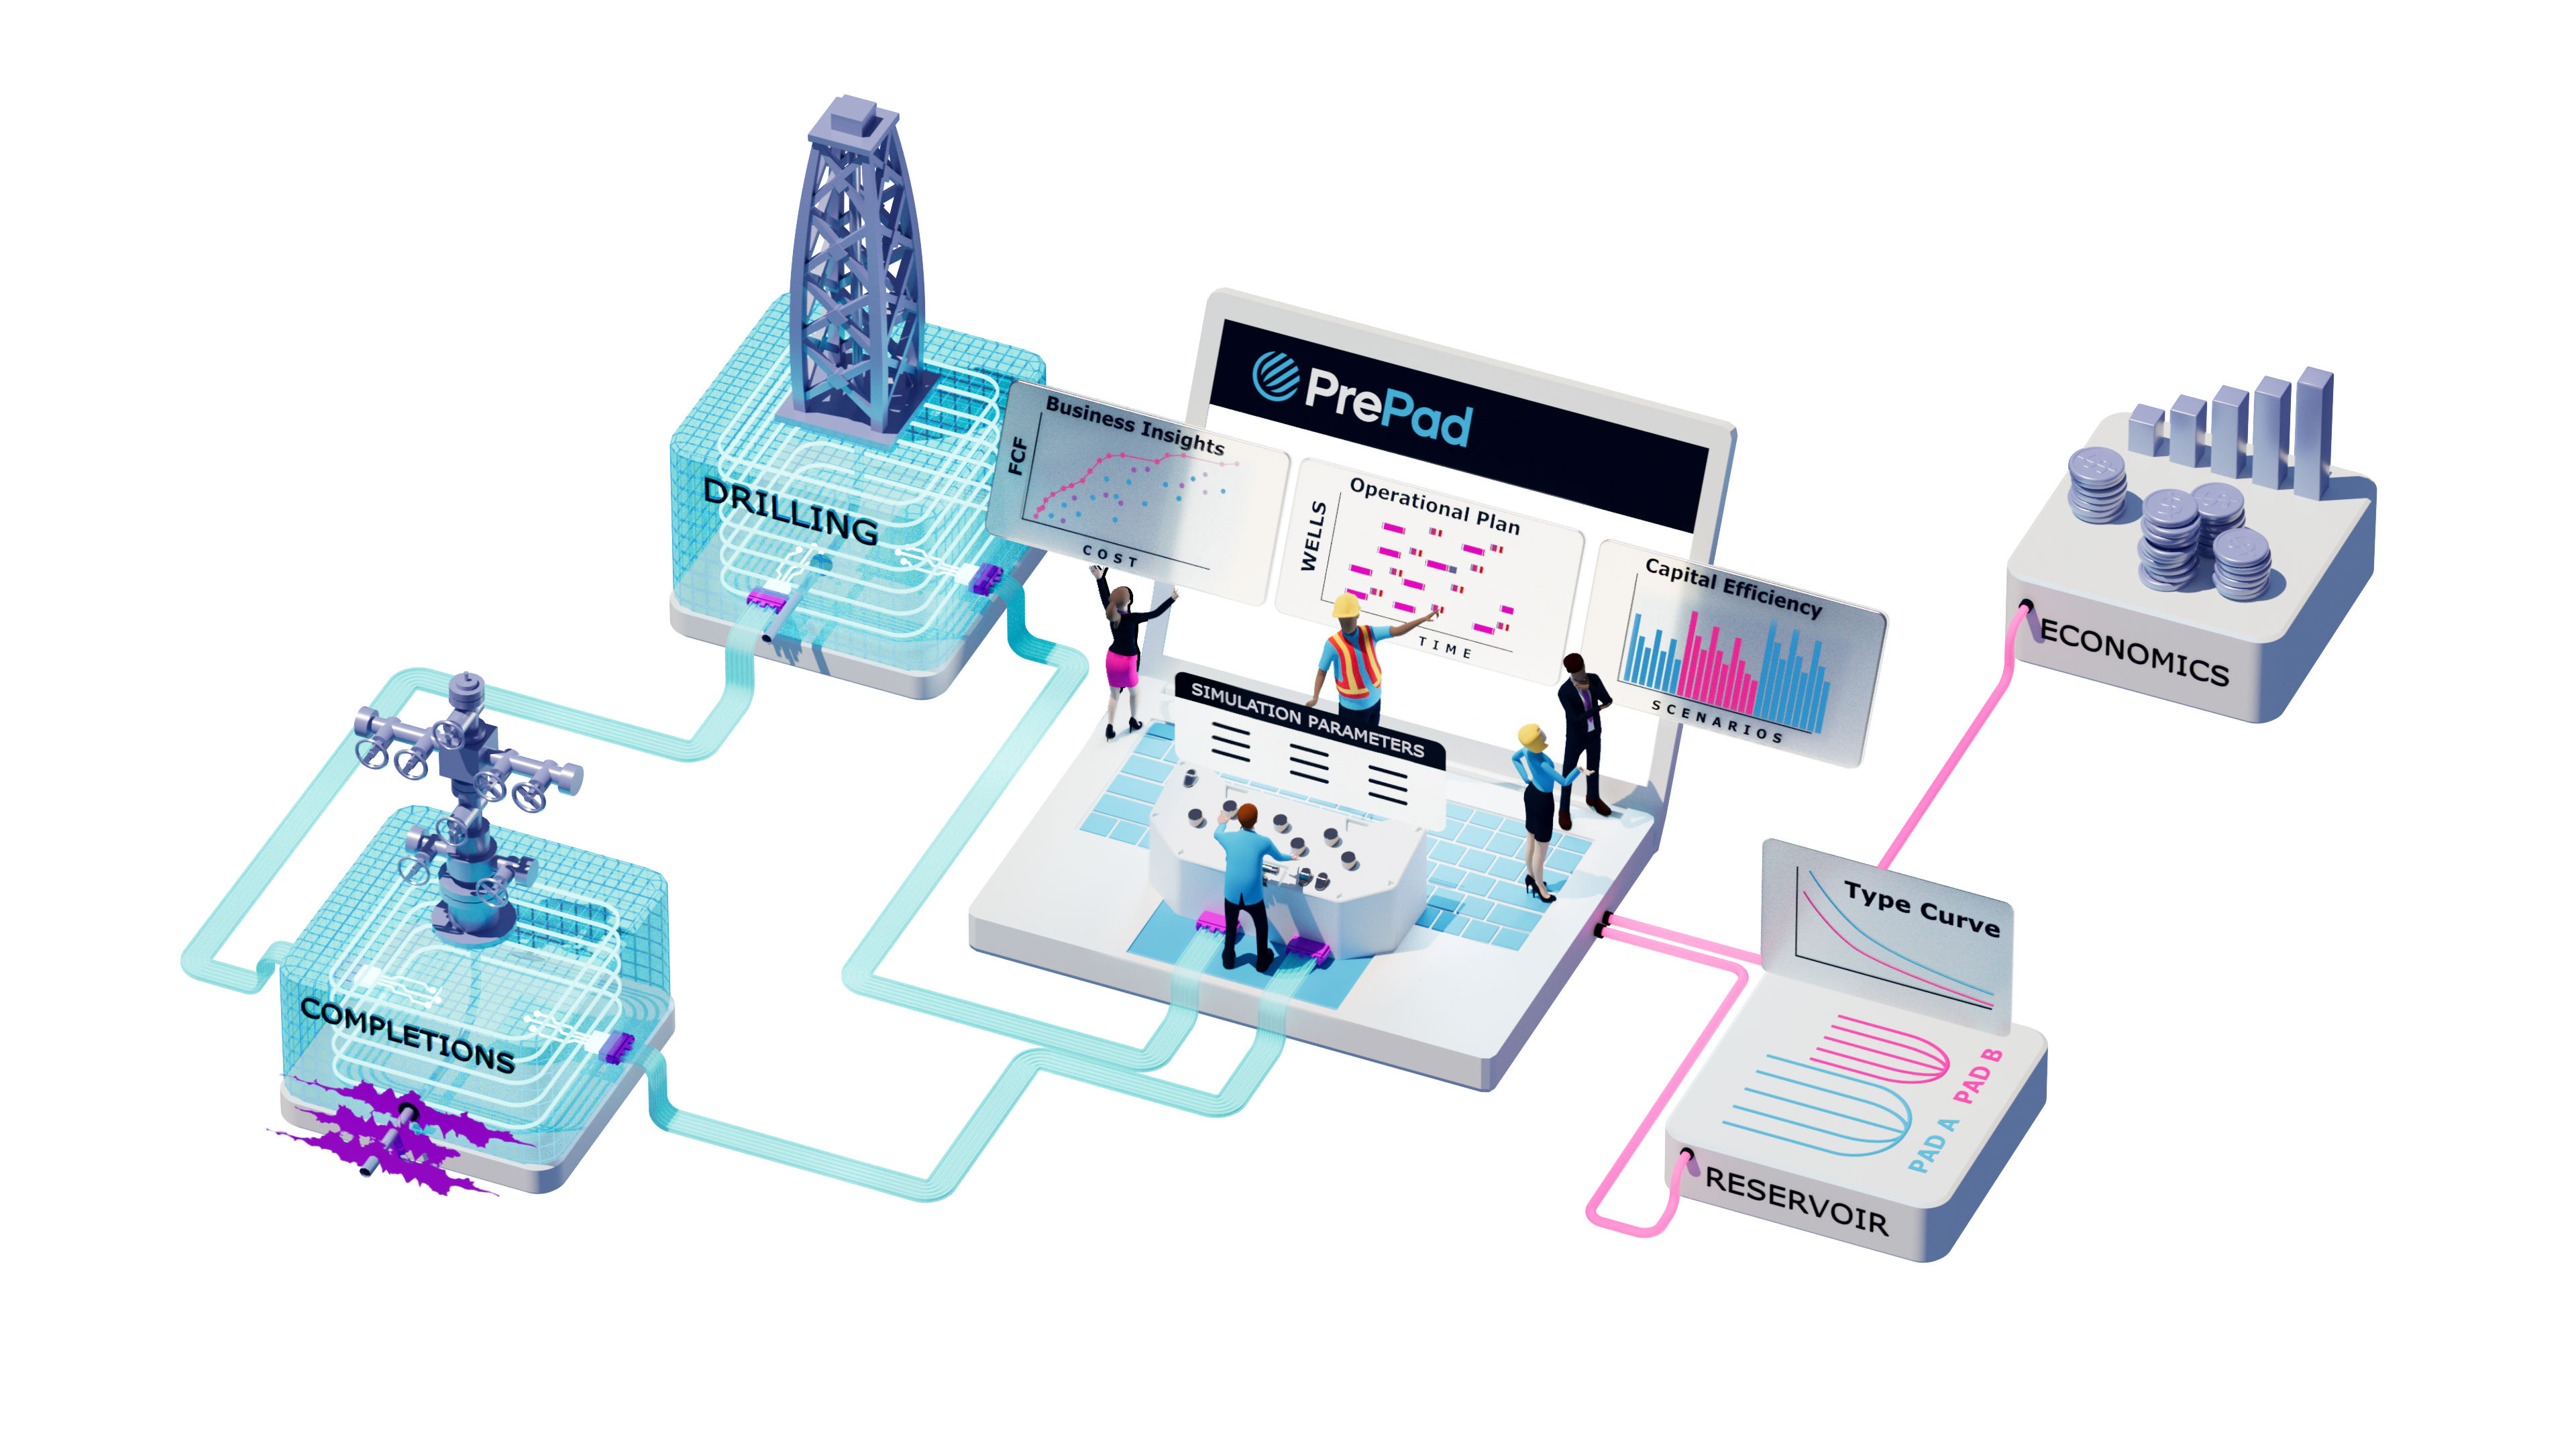
Simulate any well decision in seconds

Bring your well plan to life through a physics-based simulation of your designs, contracts, and constraints to drive better decisions.

3D illustration of an interconnected oil and gas workflow with drilling, completions, reservoir type curves, emissions, economics, and a central PrePad simulation control panel with figures analyzing data.

Build confidence
into every design

"Industry's only completions process simulator"

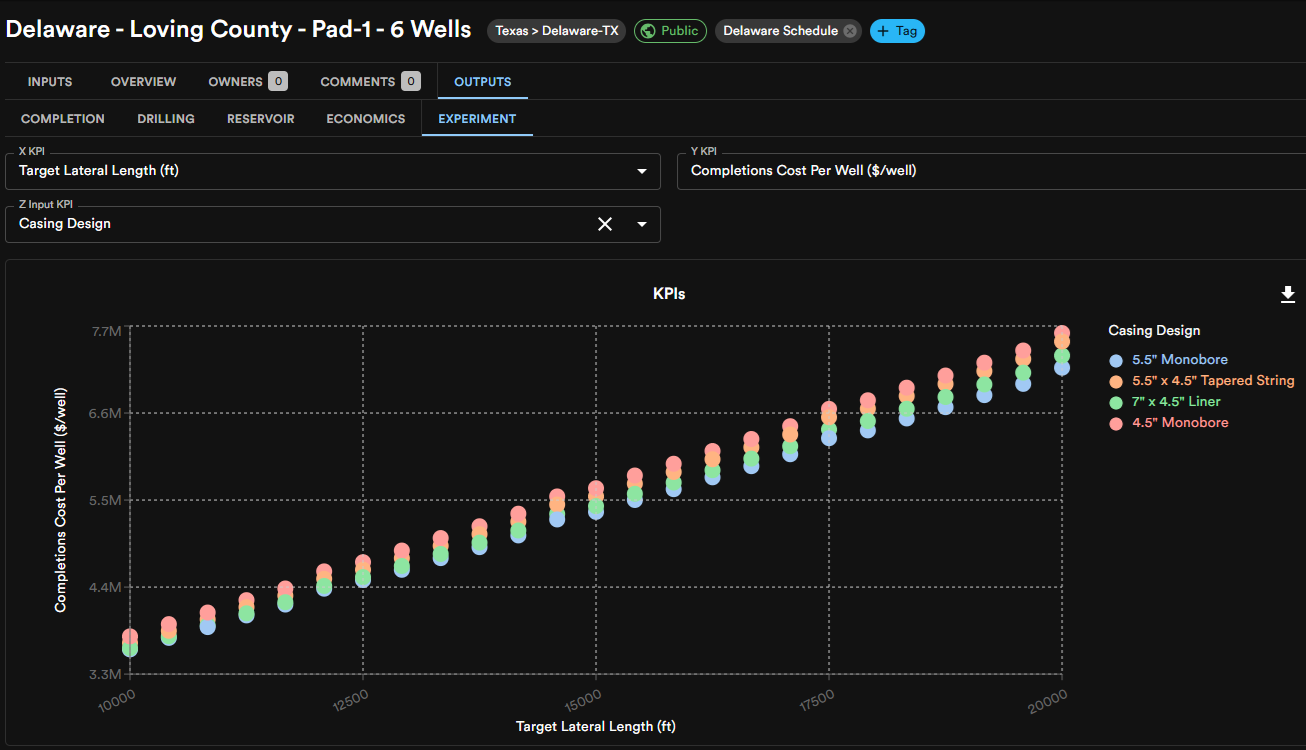
Answer any “what-if?”

Adjust variables and instantly see the operational and economic impact of each choice.

Scatter plot showing completions cost per well in dollars versus target lateral length in feet for different casing designs in Delaware - Loving County Pad-1 with 6 wells.

Pressure test every plan

Compare thousands of designs in minutes and surface the tradeoffs that drive cost, time, and risk.

Interface showing experiment design sliders and input fields for parameters like lateral length, wells per pad, fluid and sand loading, clusters per stage, cluster spacing, frac phase NPT, load rate, max pumping flow and pressure, tortuosity pressure loss, and friction reduction factor, with resource dropdowns and run experiment button.

Built around your operation

Bring cost models, design rules, and constraints into one transparent simulation that behaves like your field.

Dashboard for Delaware - Loving County - Pad-1 displaying well costs by line items with columns for cost code, cost unit, prep phase, frac phase, drillout phase, rig out phase, and total costs, featuring a dark-themed interface and navigation menus.

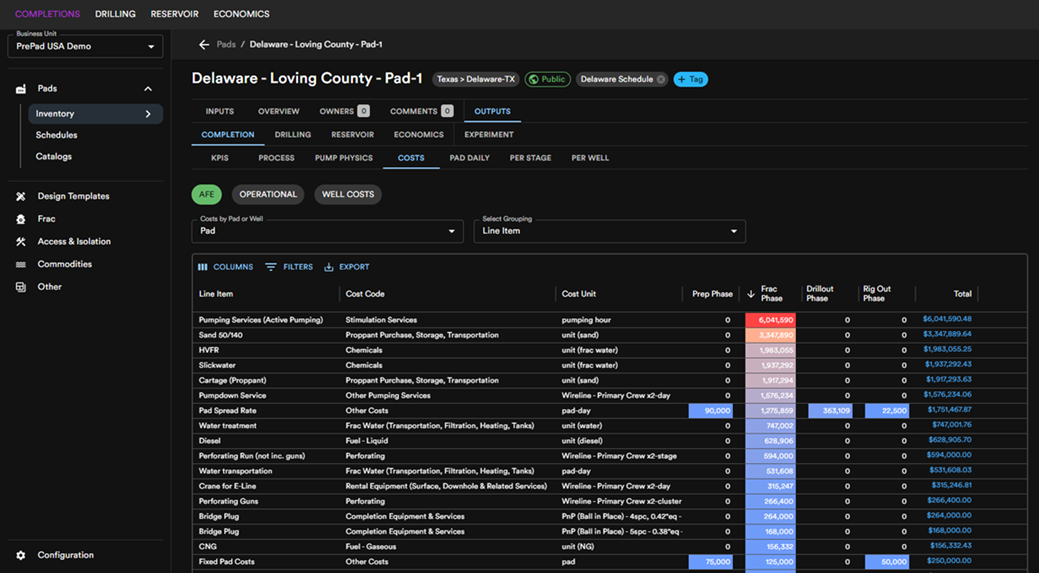
Run simulations, not spreadsheets

Model completions with a discrete-event engine that captures pumping physics and contract logic.

Quantify every tradeoff

Turn rates, cycle time, and costs into clear dollar impact across pads and programs.

Win the boardroom

Explain the bottom line with simple narratives, visual deltas, and decision-ready summaries.

HEAR IT FROM THEM

"... we have full confidence in PrePad's ability to augment our capabilities"

Kyle Haustveit - Completions Manager, Devon Energy

Jessica S.
Completions Engineer, Shell
“Don’t take PrePad away from me”
Kevin J.
VP Engineering, Lotus Creek Exploration
"PrePad helped Artis discover ways to increase 2-year free cash flow by $500k per well."
Jeff H.
Asset Manager, Large US E&P
"User interface is modern and sleek, which is a perfect fit for this innovative simulation tech."
Steven D.
Completions Analyst, Large E&P
"PrePad can evaluate multiple complex bids from service providers and narrow down the best contracts for our well manufacturing operations - potentially saving our company +$10M"
Terry F.
Technology Advisor, Large Canadian E&P
"Once the environment was set up, I was able to run multiple experiments on design choices that uncovered over $350k/well in savings"
Kyle H.
Completions Manager, Devon Energy
"Insight into time and cost dynamics is indispensable in our operations, and we have full confidence in PrePad's ability to augment our capabilities"
John D.
Technology Manager, Mid-Size E&P
"PrePad's platform integrates crucial disciplines, improving collaboration and aligning efforts with our financial goals."
Matt S.
Completions Engineer, Large US E&P
"I was able to do simulate this in 10 minutes with PrePad. Before I wouldn't have had the confidence in my calculations; it wouldn't have been as accurate."
Kayla D.
Completions Intern, Large Canadian Producer
"This tool is so easy to use, even I learnt it as an intern after just a few simulations!"
Sarah L.
Technology Strategist, Large E&P
"PrePad is a must-have for anyone serious about managing their technical business. It’s both powerful and user-friendly."

Everything You Need To Decide

Supply chain & materials

Roll-up annual consumables like fuel, sand, chemicals, and water to support sourcing logistics.

Dashboard screen showing PrePad USA Demo business unit with a Delaware 2026 schedule, timeline bars for various projects from April to October 2026, and a stacked bar chart of total fluid in barrels over time from March 26 to Oct 26, 2026.

Program planning

Compare budgets and timelines across pads.

Reporting

Bar and line graph titled 'Total Diesel Consumed' showing daily diesel consumption from day 5 to 22 with consumption peaking around day 8 to 13 and then declining to nearly zero by day 22; a cumulative diesel consumption line rises steeply until day 21 then plateaus.
Scatter plot showing 2-Year FCF ($MM) versus Completions Cost ($MM) with data points clustered by 4 and 5 clusters, and a dashed line indicating Local Max trend.

Data transparency

Execution timeline table showing tasks for four Delaware wells on July 7 from 8:00 to 11:00 with activities including Remove A&I, Pump Frac, Frac Maint., and Deploy A&I highlighted in blue, orange, pink, and blue respectively.

Execution timelines

See Gantt, critical path, and cycle time by phase.

Scatter plot of FCF per well versus target lateral length with three colored data sets representing different sand loading values (3675, 2000, 5350 lb/ft).

Scenario modeling

Explore pad and program design space side by side.

Bar chart showing pressure drops per stage during treatment, with stacked bars for hydrostatic, tortuosity, orifice, pressure due to frac gradient, perf friction, and total friction pressures across 15 stages.

Physics & contract aware costs

Reflect pump rates, idle time, pricing matrices, and spread utilization.

Fast track to begin

Start building a field-calibrated, physics–based, and contract-aware model you can trust as the source of truth for planning and execution.

Onboarding guided by completions experts

01

Begin

Ingest & translate data

Bring in cost models, contracts, and constraints. Set up pads, programs, and more.

1-week average

02

Model

Synchronize your model

Tune pumping physics and contract logic to your historicals, and validate cycle time and cost to within 1 percent.  

2-week average

03

Optimize

Continuous support

Run scenarios, choose the best plan, and capture value, with ongoing support from PrePad.

Ongoing

Award Winning Software 3 Years In A Row